






RiskQuant
Uncertainty becomes a decision.
RiskQuant is the quantification module of the SwissGRC GRC Toolbox. It is built to move a discussion from a low, medium or high label to a range the board can use, without maintaining a second model.
OpResONE is an Authorized SwissGRC Channel Partner.
From estimates to evidence
From low, medium, high to a range
Qualitative ratings can be expressed as a distribution, so uncertainty is visible instead of hidden in a single score.
Dependencies, not only single risks
Risks can be modeled with their connections, so concentration and knock-on effects are part of the picture.
No second model to maintain
Quantification sits on the same risk data you already keep, rather than a separate spreadsheet model that has to be updated twice.
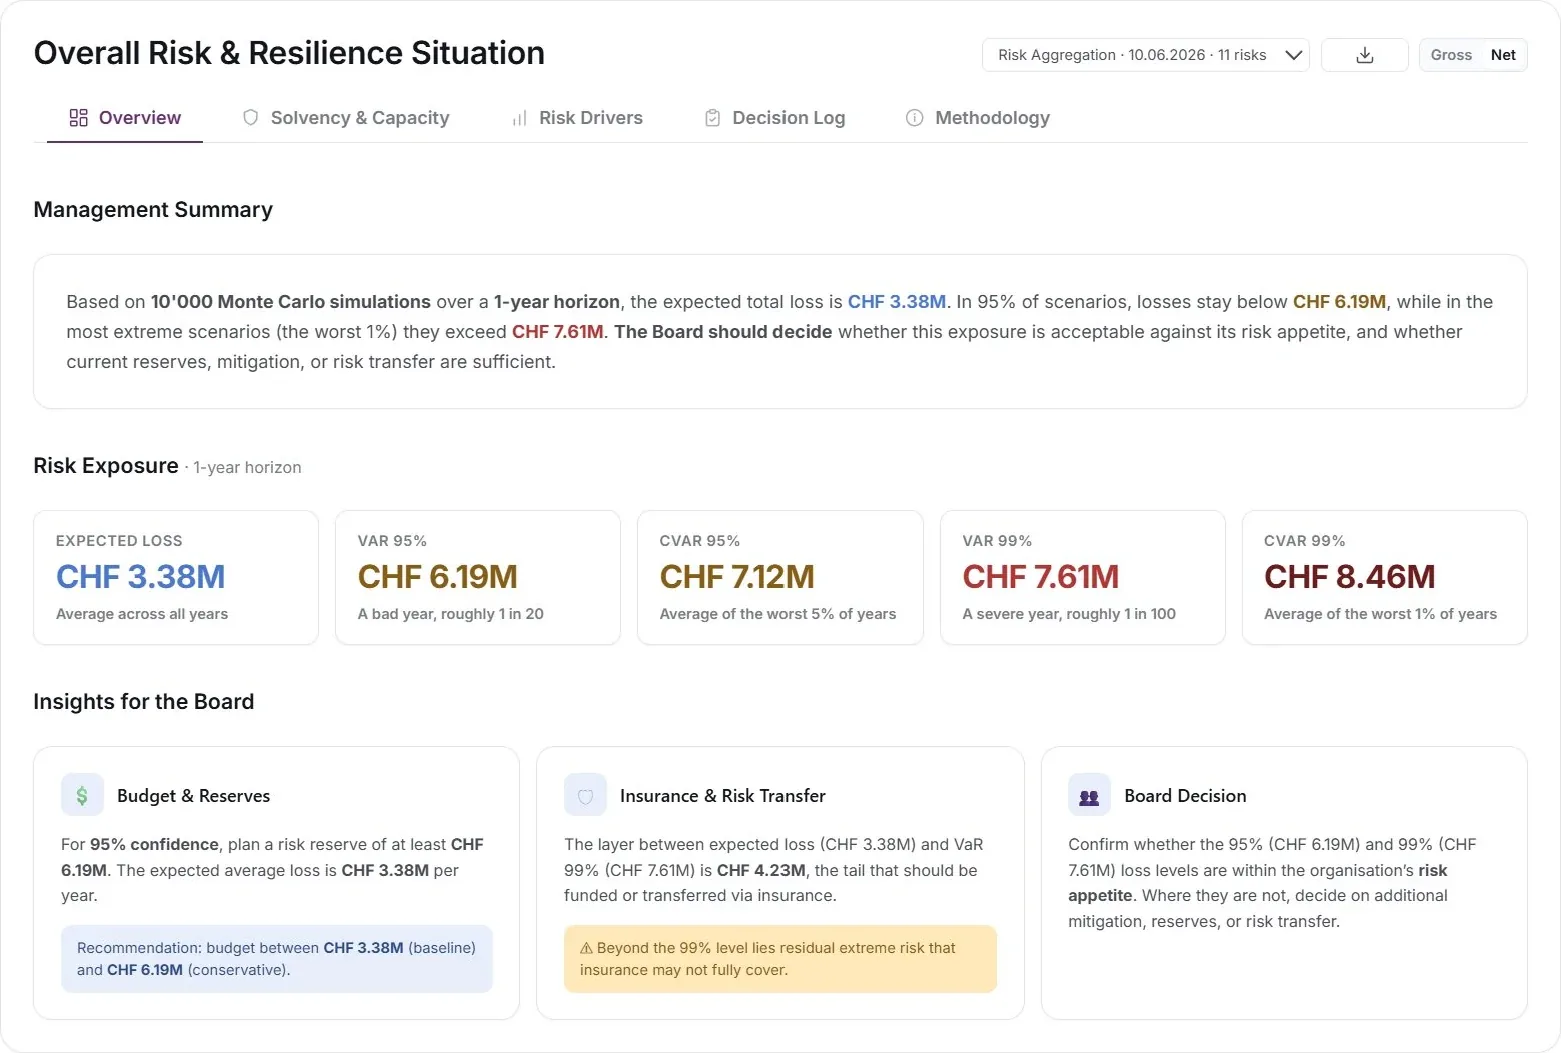
Board risk reporting: a number becomes a decision
A statement the board will read
The report is designed to lead with a clear statement, not only a chart, so decision makers can see the exposure and what it means.
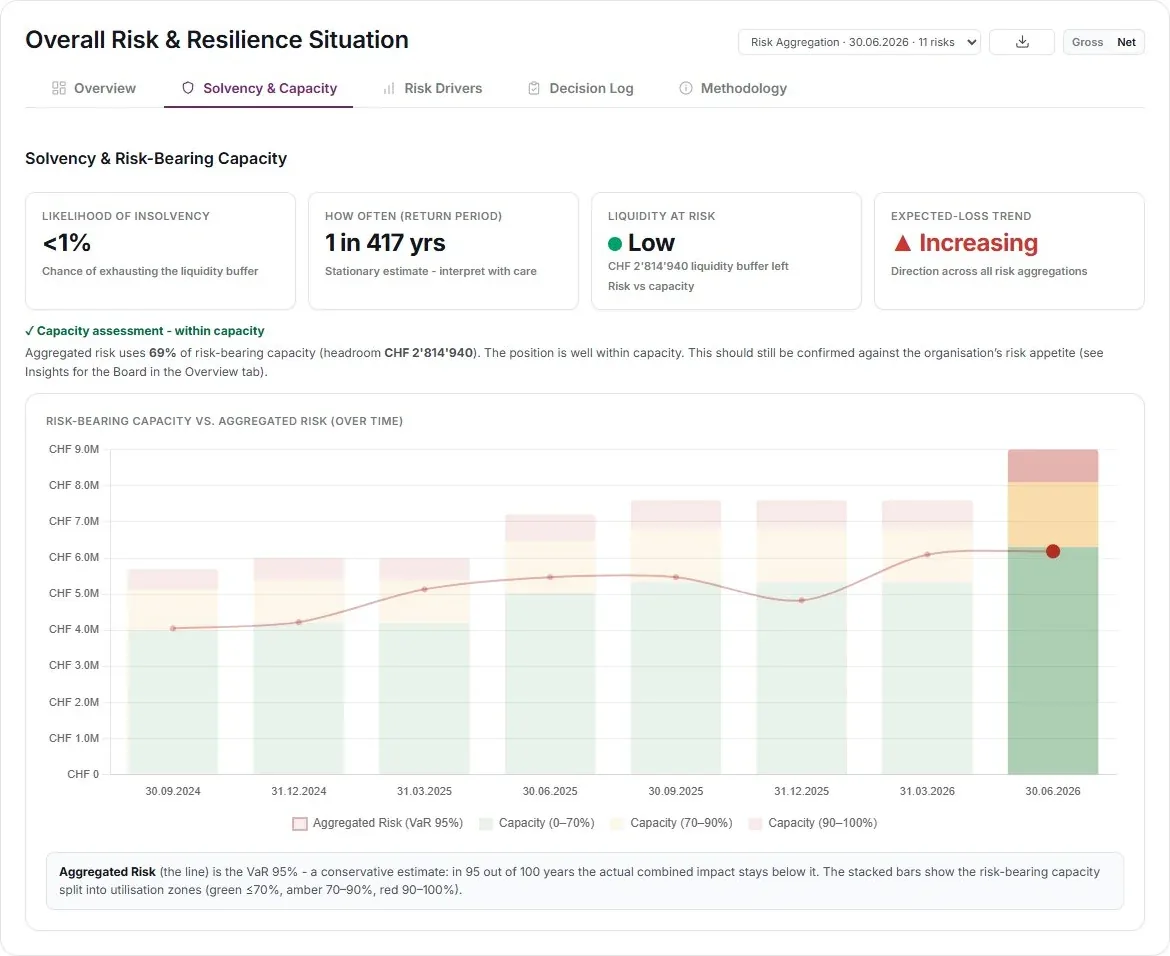
Risk against capacity
Aggregated risk can be compared with risk-bearing capacity, so the discussion is about whether you can bear the exposure, not only how it was scored.
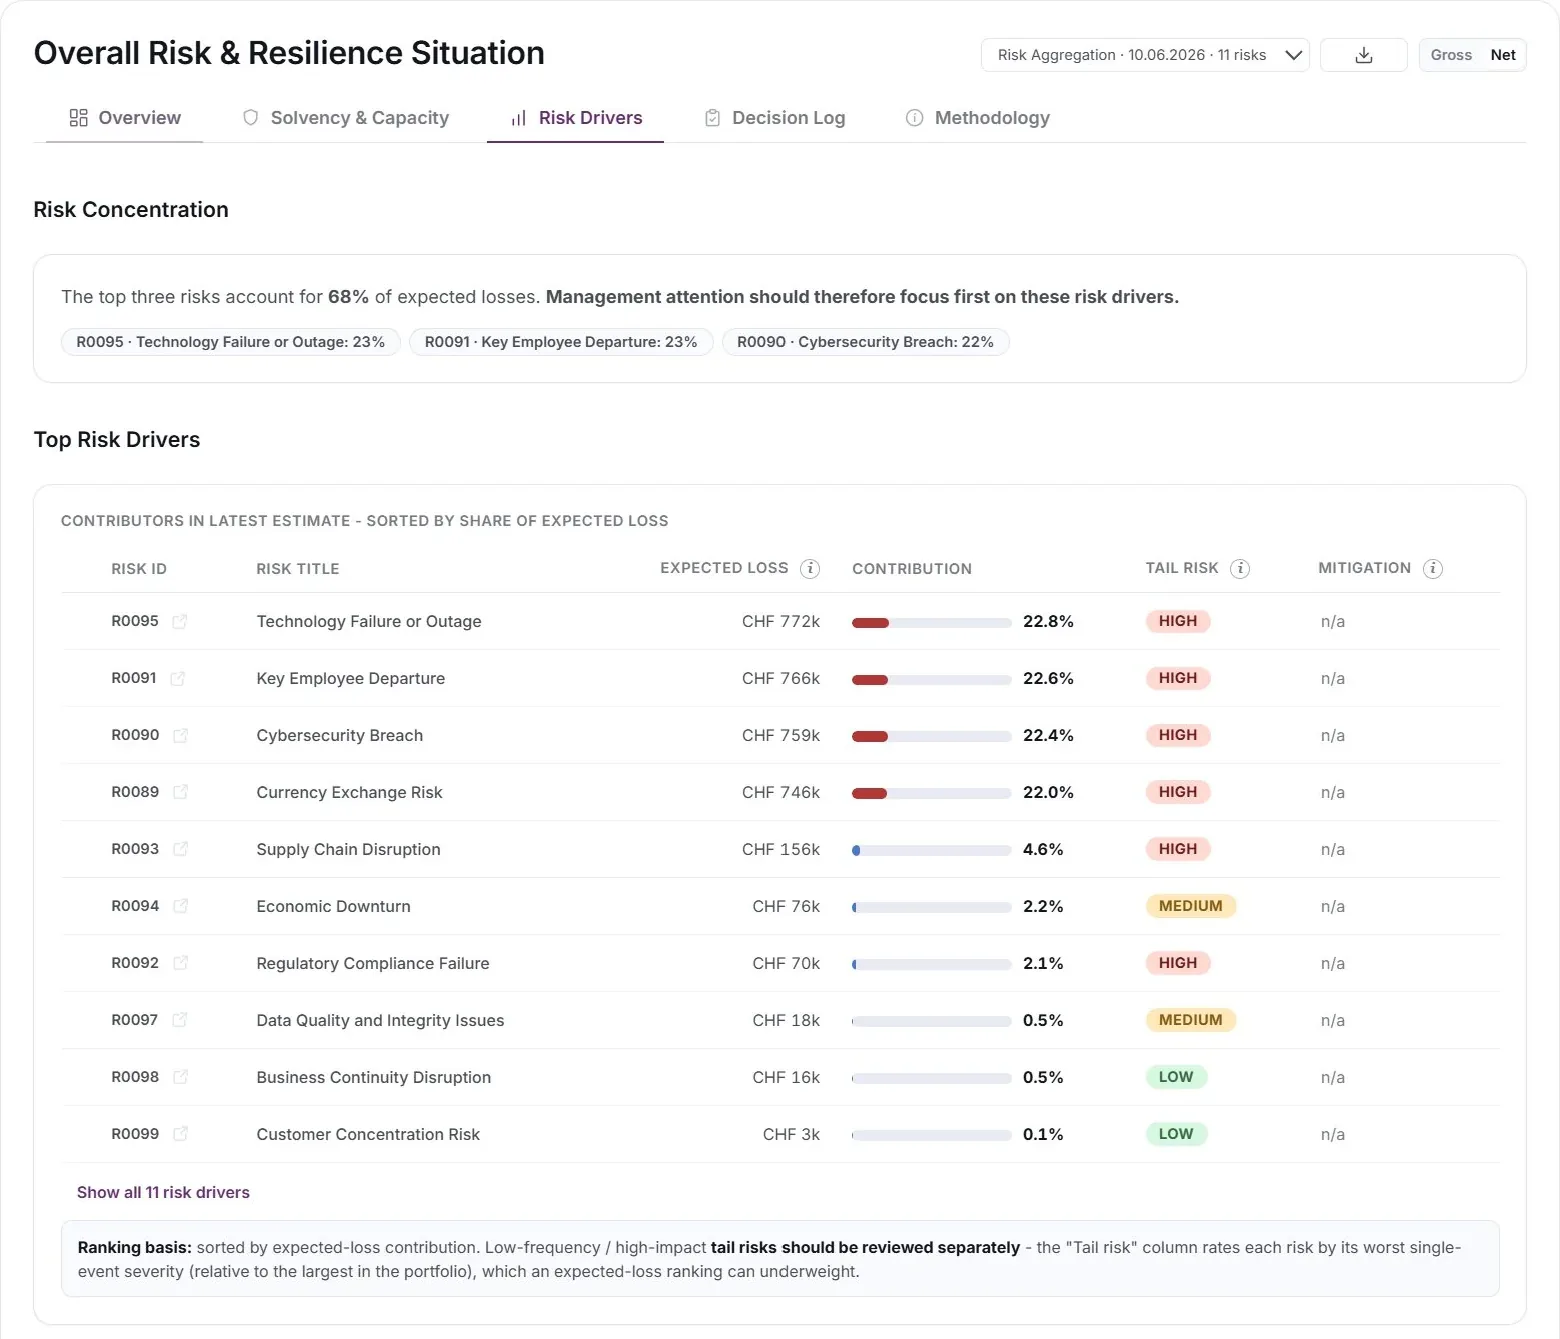
Which risks actually drive the result
The module can show which risks contribute most to the total, including cases where a small number of risks drive most of the exposure.
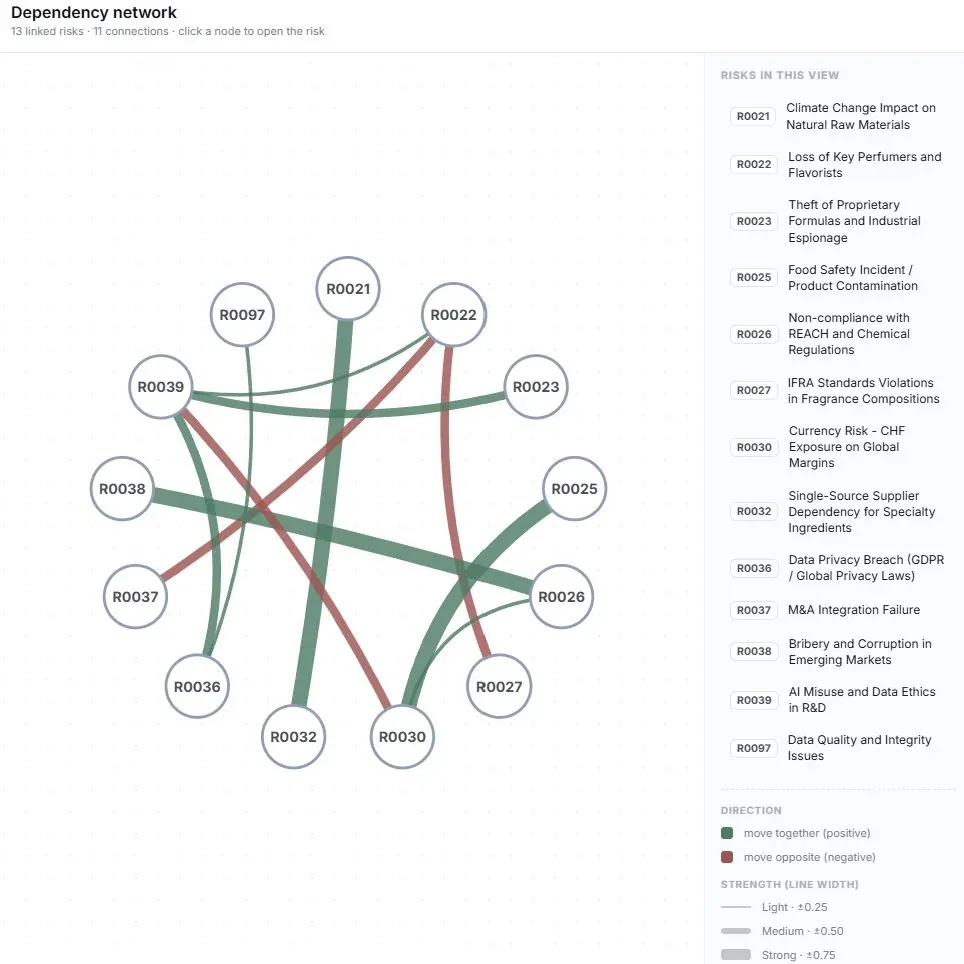
Risks do not move alone
A dependency network makes the connections between risks visible, so a change in one area is not treated as an isolated event.
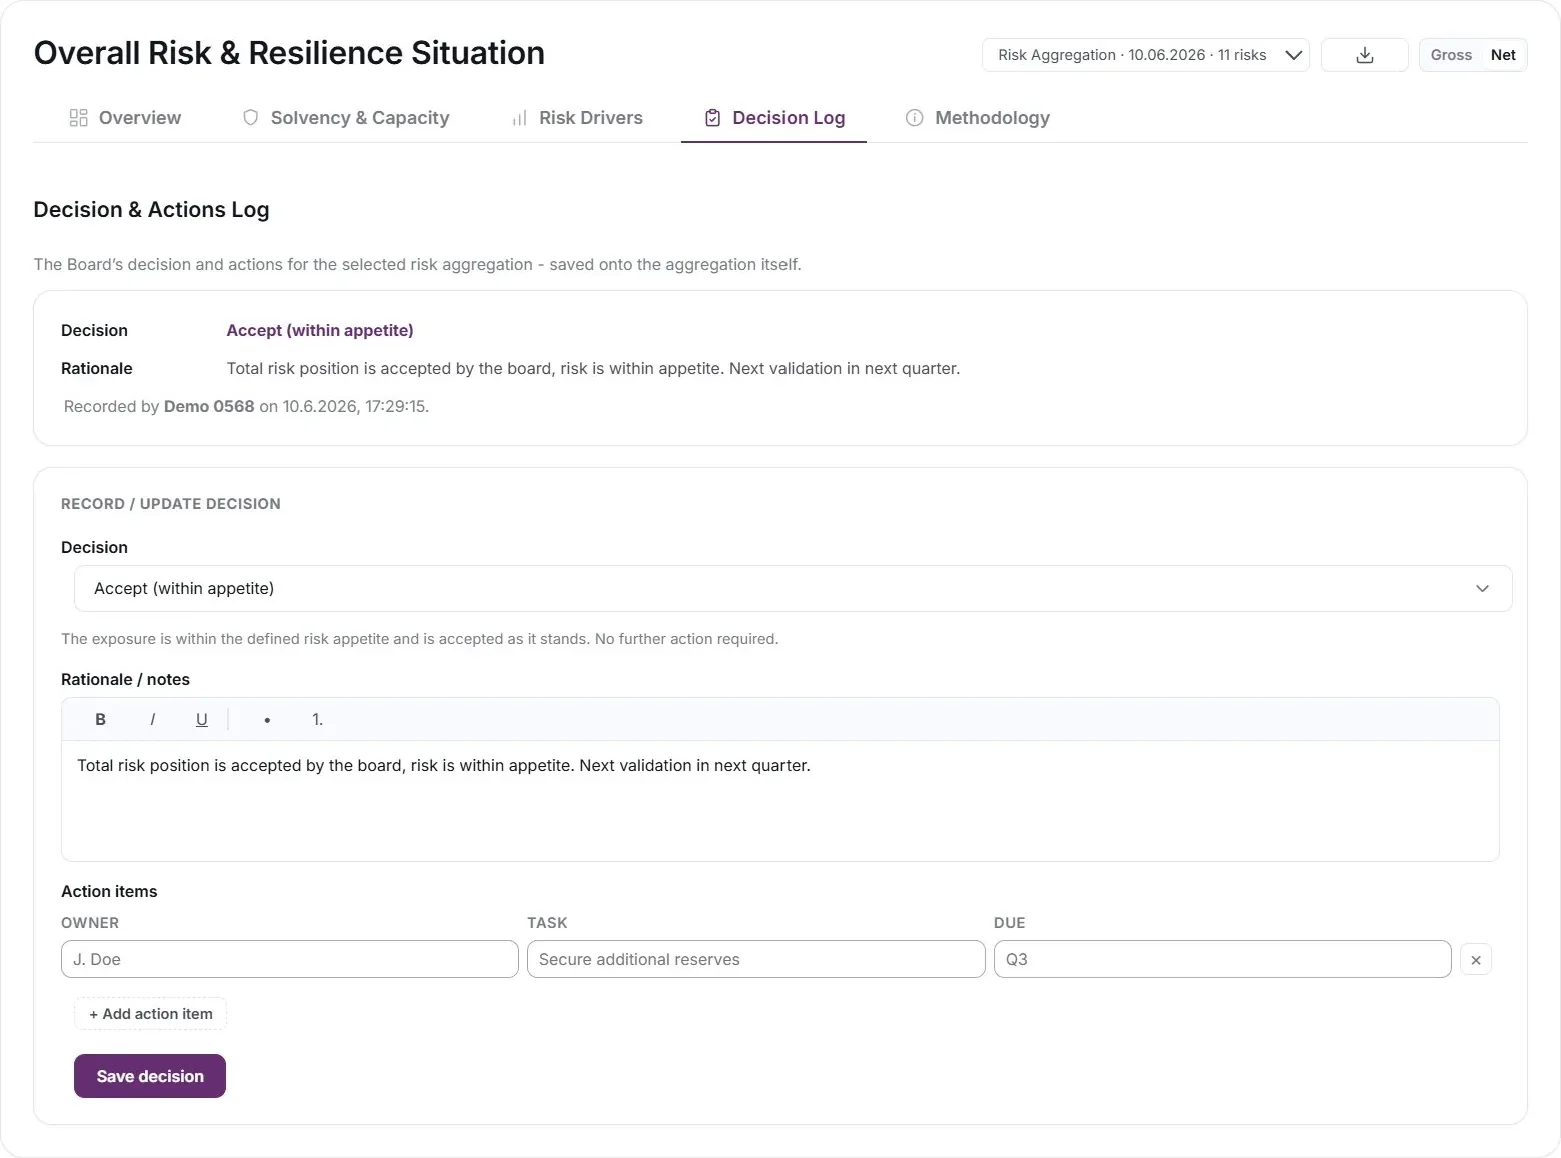
The decision is part of the report
Resolutions, rationale and measures can be recorded with the analysis, so the decision is not lost after the meeting.
Built for enterprise risk quantification
These are capabilities described on SwissGRC's RiskQuant page. We do not repeat marketing performance figures here.
Distributions and simulation
Risks can be quantified with probability distributions and simulation, including Monte Carlo methods.
Dependency patterns
Relationships between risks can be built into the model instead of treated as independent.
Stress testing
Scenarios can be used to test how the picture changes under stress.
Expected value, VaR and CVaR
Results can be expressed as expected value, value at risk and expected shortfall (CVaR).
An auditable trail
The work can leave a trail that can be reviewed, rather than living only in a local file.
One platform
RiskQuant sits with the rest of the SwissGRC GRC Toolbox, so quantification is not a side system.
Talk through RiskQuant on your own risks
Request a demo of the SwissGRC GRC Toolbox and we will include RiskQuant if quantification is what you need to show the board.


